Testing Web performance before and after website migration
Migrating a customer facing website can be a daunting task. Even if all the website functionality works correctly, it is very important to ensure that the performance of the website is not compromised.
Another reason to test website performance would be Search ranking. Various studies show that users prefer sites with a great page experience and in recent years, search has added a variety of user experience criteria, such as how quickly pages load and mobile-friendliness, as factors for ranking results.
Metrics to measure Performance:
FCP ( First Contentful Paint) – Time it takes browser to render the smallest piece of DOM content (doesn’t mean the user can see anything on the screen)
LCP (Large Contentful Paint) – Time it takes browser to render the largest piece of DOM content
Speed Index – measures how quickly content is visually displayed during page load (the visual progression between frames)
Time to interactive – How long it takes for our page to become interactive
Total Blocking time – Time the page is blocked when responding to user events such as button clicks (sum is calculated by adding the blocking portion of all long tasks between First Contentful Paint and Time to Interactive)
Cumulative Layout shift – Measures how often the page layout shifts while the page is loading. A layout shift occurs any time a visible element changes its position from one rendered frame to the next.
First Input Delay (FID) - It measures the time from when the user interacts such as click a button, tap a link, etc to the time when the browser is able to begin processing the event handlers in response to that particular action.
The lower the scores, the better is the performance.
CORE Web Vitals?
A subset of all performance metrics that aims to provide guidance for delivering a great UX on the web.
These metrics are considered as the essential metrics for a healthy site. LCP,FID and CLS come under CORE Web Vitals.
Current Thresholds

Tools that can be used to measure website performance:
Google Lighthouse :
An open-source, automated tool for measuring the quality of web pages. Google Lighthouse audits performance, accessibility and search engine optimization of web pages.
Options to run Lighthouse
- Chrome Dev tools
- Browser Extension
- web.dev/measure
- Lighthouse CLI (can be used to use in CI/CD pipeline)
- Cypress-audit plugin
Using chrome dev tools:
Navigate to site -> right click inspect-> Select Lighthouse tab ->select category Performance and click Analyze page load.
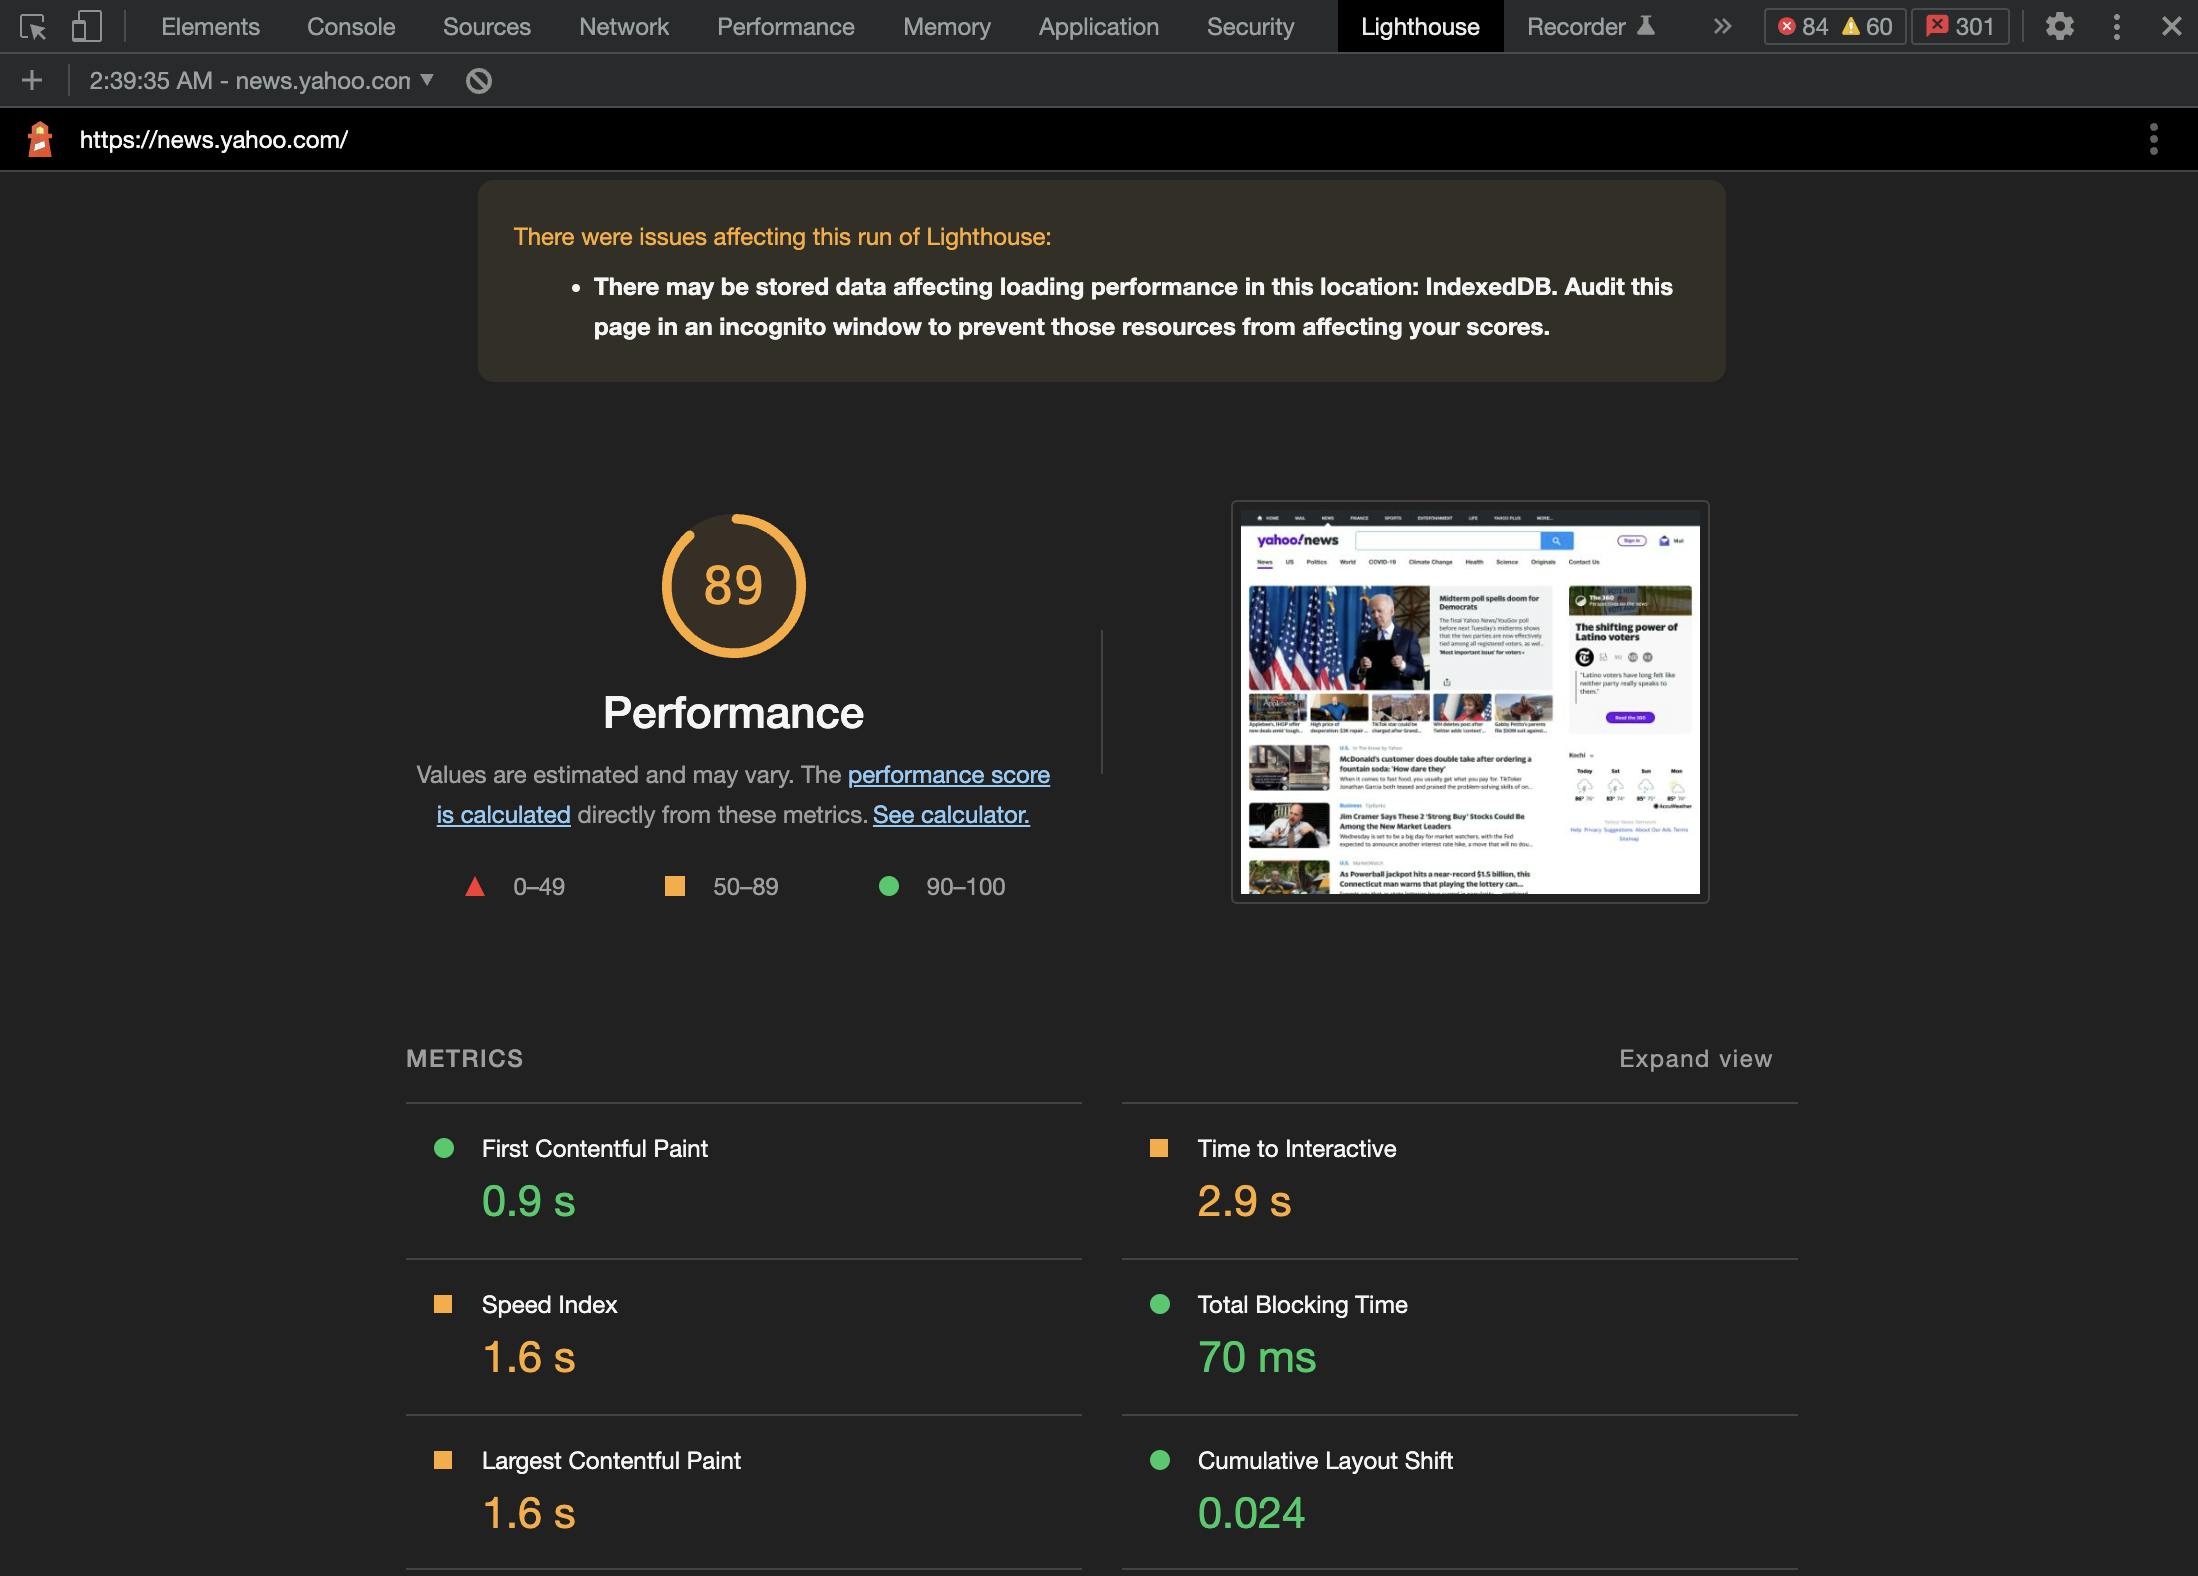
An example for testing performance of yahoo news is as follows:

PageSpeedInsights
It uses Lighthouse in a simulated environment for the Performance, Accessibility, Best Practices, and SEO categories.
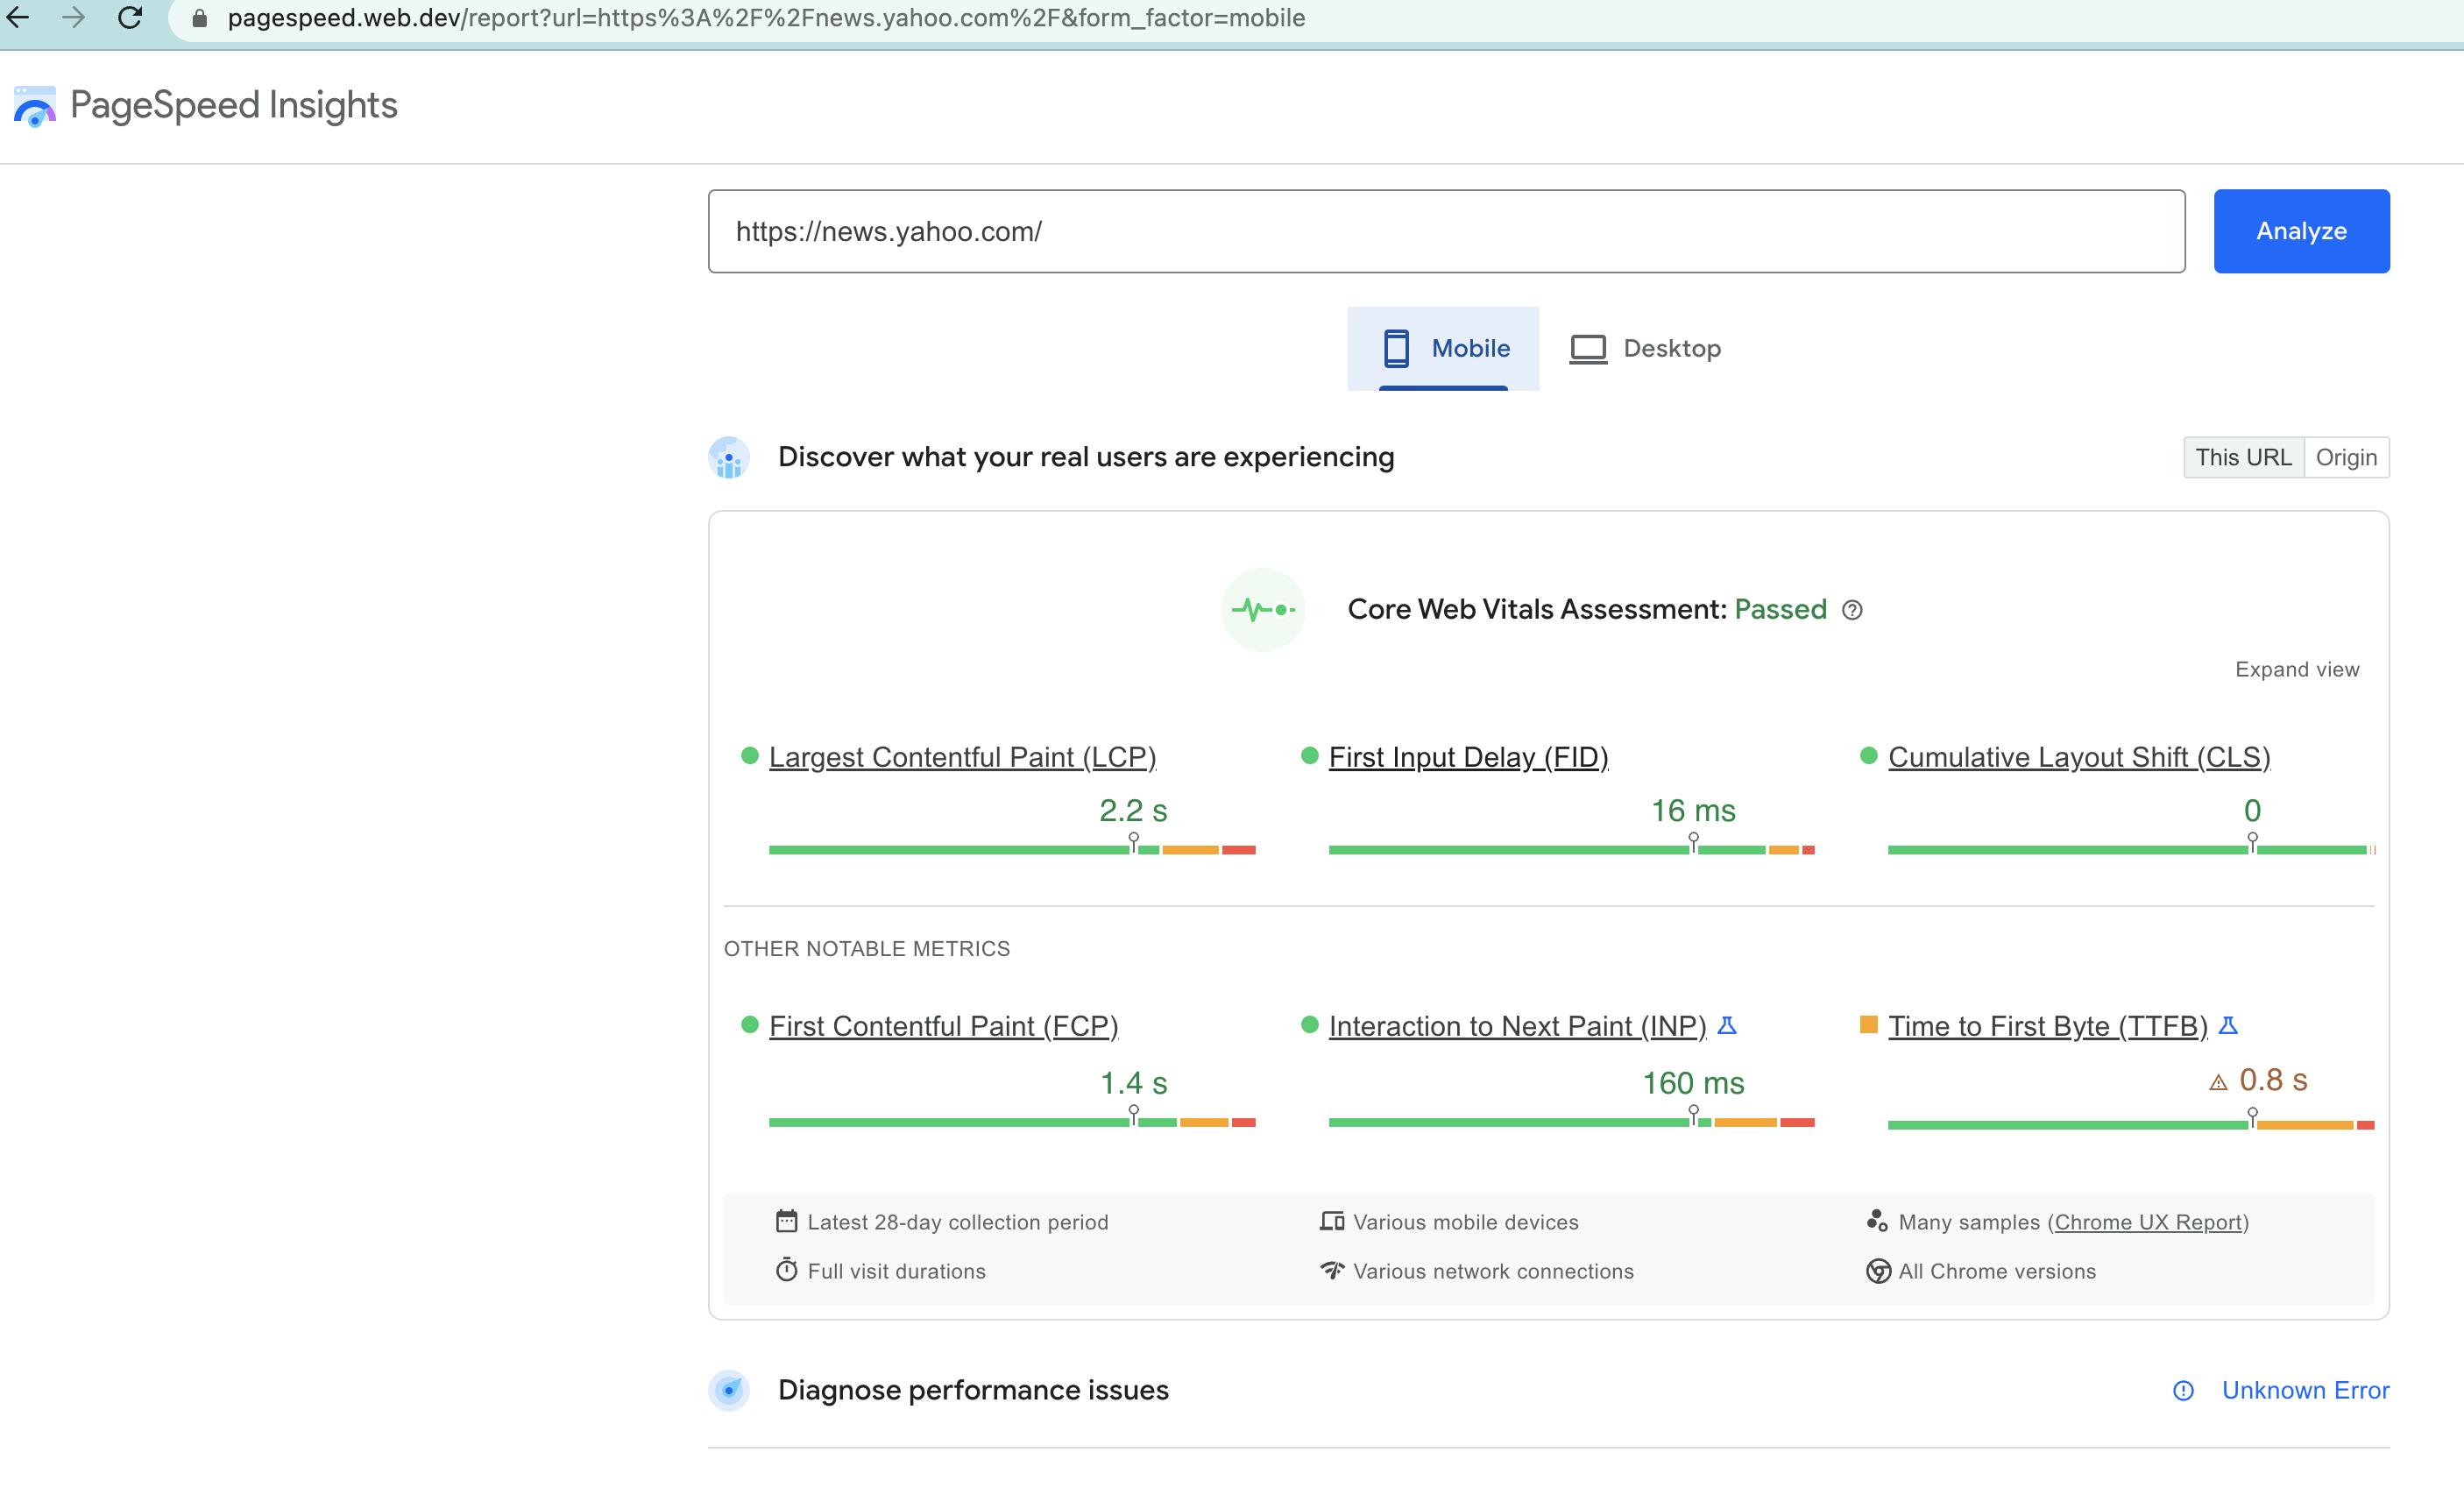
An example for testing performance of yahoo news is as follows:

Web Vitals Chrome Extension
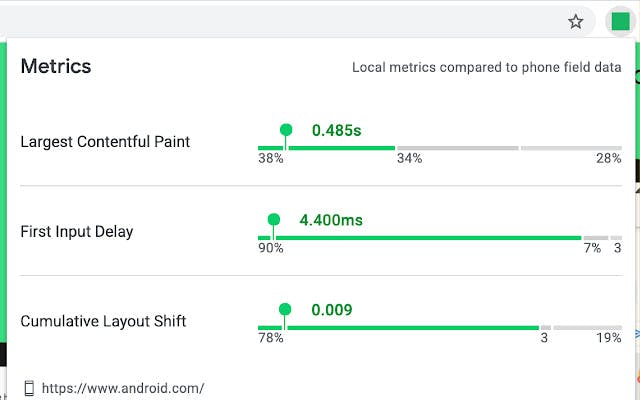
After installing this chrome extension, performance scores of any websites can be quickly obtained.
Navigate to the website and open the extension to get the quick performance score

xk6-browser
While the tools listed before would all provide quick performance scores, it was found that there are inconsistencies when the test was run again which makes sense as the page load can depend on server health, network speed,etc.
This is where xk6-browser is more advantageous.
It allows us to write scripts and run tests for n number of times with multiple virtual users. Hence, we can get an average of all the scores which would be a more accurate performance score.
xk6-browser provides browser automation and end-to-end web testing while supporting k6 features.
Following is an example xk6-browser script to test the performance of yahoo news page.
import launcher from 'k6/x/browser';

export let options = {
    summaryTrendStats: ["avg", "min", "med", "max", "p(95)", "p(99)", "count"],
    summaryTimeUnit: "s",
    scenarios: {
        login_function: {
            executor: "constant-arrival-rate",
            duration: "30s",
            rate: 2,
            timeUnit: "1s",
            maxVUs: 5,
            preAllocatedVUs: 2,
            exec: "yahooNewsFunction",
        },
    }
};

export  const yahooNewsFunction = () =>  {
    const browser = launcher.launch('chromium', { headless: false });
    const context = browser.newContext();
    const page = context.newPage();

    page.goto('https://news.yahoo.com/',{waitUntil: 'networkidle'});

    page.screenshot({ path: `xk6BrowserTest.png` });

    page.close();
    browser.close();
}
We can run the above code snippet using the command (xk6Test.js is the filename)
./xk6-browser run xk6Test.js
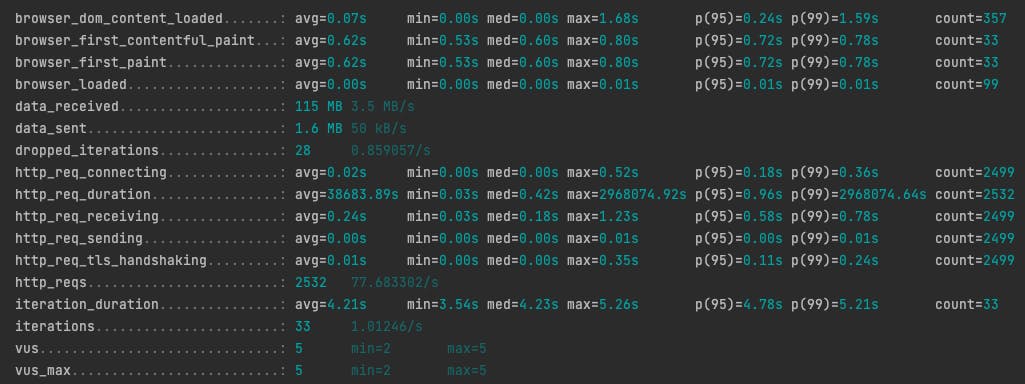
The above code runs with 5 virtual users and for 30s. After the run the following results were obtained.

Comparing the performance before and after website migration
One of the approach would be to run xk6-Browser scripts before and after migration and compare the results.
- Create xk6-Browser scripts for navigation to different pages in application. Run at least for 1000s with 5-10 virtual users.
- Run the scripts for different pages in old and new host
- Compare the values in old and new host.
Example:

In the above example results, we can see that some values were better in new host. Couple of values were not good but it didn't increase significantly in new host and is still acceptable.